Web application interface overview
Getting started
The StorONE system includes an HTML5-based graphical user interface (GUI) for managing the system. The GUI supports most major modern browsers.
To open the web application follow these steps:
-
Open your web-browser
-
In your web-browser, enter the IP address of the management network interface that was configured for the node server. The web service page appears.

-
Select Web GUI, the web GUI login page appears.

-
In the login dialog box, enter the user name and password and select Sign in. If the login and password are correct, the Web Application Home page appears.

The Home page provides concise graphical information that gives an overview of the system. This includes information about the distribution of total capacity, storage capacity of the pools, IOPS and throughput, IO size and latency, and utilization of computing resources.
The interface
The web application has three types of navigation menus:
- Top navigation menu
- Sidebar menu
- Sidebar toggle menu

Top navigation menu
| Icon | Name | Functionality |
|---|---|---|
 |
Logout | Logout session. |
 |
Dark Mode | Toggle between dark and light themes. |
 |
Sandbox mode | Toggle between sandbox and production modes. When in sandbox mode, changes and execution won’t take effect. |
 |
Show CLI script | Show the equivalent CLI command and the rest API script for the operation performed in the web application. |
 |
Notifications | Display recent S1 system notifications. To view all notifications, select See All Notifications. |
 |
Configurations | Display recent configurations of the S1 system. To view all past configurations, select See All Configurations. |
 |
Health Monitor | Displays S1 hardware and software health. For detailed view select Monitoring Health Details. |
 |
Volume Provisioning | Create new (provision) or edit existing volumes. |
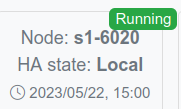 |
HA state | Monitor the HA state of the node. |
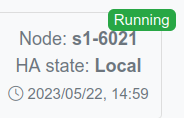 |
HA state | Monitor the HA state of the other node. |
 |
System Name | The name of your S1 system. Here “Cloud1” indicating the name of the system. |
 |
Home | Go to the Home page. |
 |
Collapse menu | Toggle between collapsed and expanded sidebar view. |
Sidebar menu
| Icon | Sidebar menu | Description |
|---|---|---|
| Application Volumes | Enables you to allocate volume levels for different applications and their usage. | |
| Monitoring | Enables you to monitor storage and system settings. | |
| Inventory | Enables you to monitor and configure floating IP, create and edit new pools, and view network status. | |
 |
Administration | Enables users to administer the system, including setting emails for notifications, creating and editing users, and setting notification targets. |
Tables
The S1 web application incorporates interactive tables that offer several capabilities, including:
- Column expansion: Users can expand columns to view additional information or widen the display for better readability.
- Column and row filtering: Users can apply filters to the columns and rows, enabling them to display specific subsets of data based on desired criteria.
- Detailed information extraction: By double-clicking on a row, users can extract detailed information associated with that particular row. This functionality allows for a closer examination or access to additional data related to the selected row.
Dynamic Table Manipulation
Some of the table allow on-the-fly operations:
- Use Show to control the number of rows displayed per page.
- Use the Search text-box to filter the table.
- To filter the table by searching within a specific column, use the search box in the last row of that column.
- Use the Choose Column
 admin drop-down list to expand or reduce columns in the table.
To download the table, select JSON, XML, YAML, or CSV.
Managing fields
Within the S1 web application, the execution of operations and extraction of information depend on the completion of fields. Fields can be characterized as follows:
- A field can be either mandatory or optional. A field is considered mandatory if it is marked with a red asterisk icon
 .
. - Fields with the Remove icon
 can be removed by selecting the icon.
 - The Add application
 icon, allows to add additional settings to the field.
Monitoring operations
The S1 web application interface displays a notification balloon for each executed operation.
- Successful operation: When the S1 system completes operation successfully, a notification balloon appears on a green background.
- Pending operation: When operation is pending, a notification balloon appears on a yellow background.
- Failure operation: When an operation fails, a notification balloon appears on a red background.
The S1 system also logs notifications. You can view these notifications by selecting Notifications from the top navigation menu. You can display all logged notifications by selecting See All Notifications.
No comments to display
No comments to display